- Development & tooling
- Methods
BâtIA — predicting building failures
A 30-hour hackathon prototype that ranks the equipment of a housing estate by failure risk, explains every score and orders the renovations under a yearly budget
Context
The Hackathon IA for Impact 2026 closed the La Mêlée Numérique festival in Toulouse: 30 hours non-stop, mixed teams, projects judged on their impact, their viability and how far the prototype actually got. Six of us took on the challenge set by Action Logement and In’li Sud-Ouest: predicting building failures.
A social landlord usually replaces the oldest equipment first. On the pilot estate of the challenge data — 1,100 dwellings, 8 residences, 1,285 pieces of equipment tracked — that rule misses most failures: inspecting the 128 oldest items catches only 17 of the year’s 66 complete breakdowns. The signals that would have helped are already in the files: the technicians’ comments (“spare part hard to get”, “repeated restarts”) and the tenants’ requests. Nobody cross-references them.
BâtIA cross-references them. It ranks every piece of equipment by its risk of failing within nine months, shows the share of each reason in the score, and orders the renovation operations under €1.5 M a year. The whole prototype runs on the challenge’s fictitious data kit: 13 CSV files, 10,067 interventions recorded between 2018 and 2025.
The whole thing was built in 30 hours: two models trained offline, an API that serves precomputed scores, and a front end that still works without a network. No language model is involved anywhere — every sentence on screen comes from the data through deterministic rules.
Architecture
Scores computed offline, a read-only API, a map in the browser
What the prototype does
Five screens, from the whole estate down to a single boiler, and from today’s urgency to the plan for 2034.
-
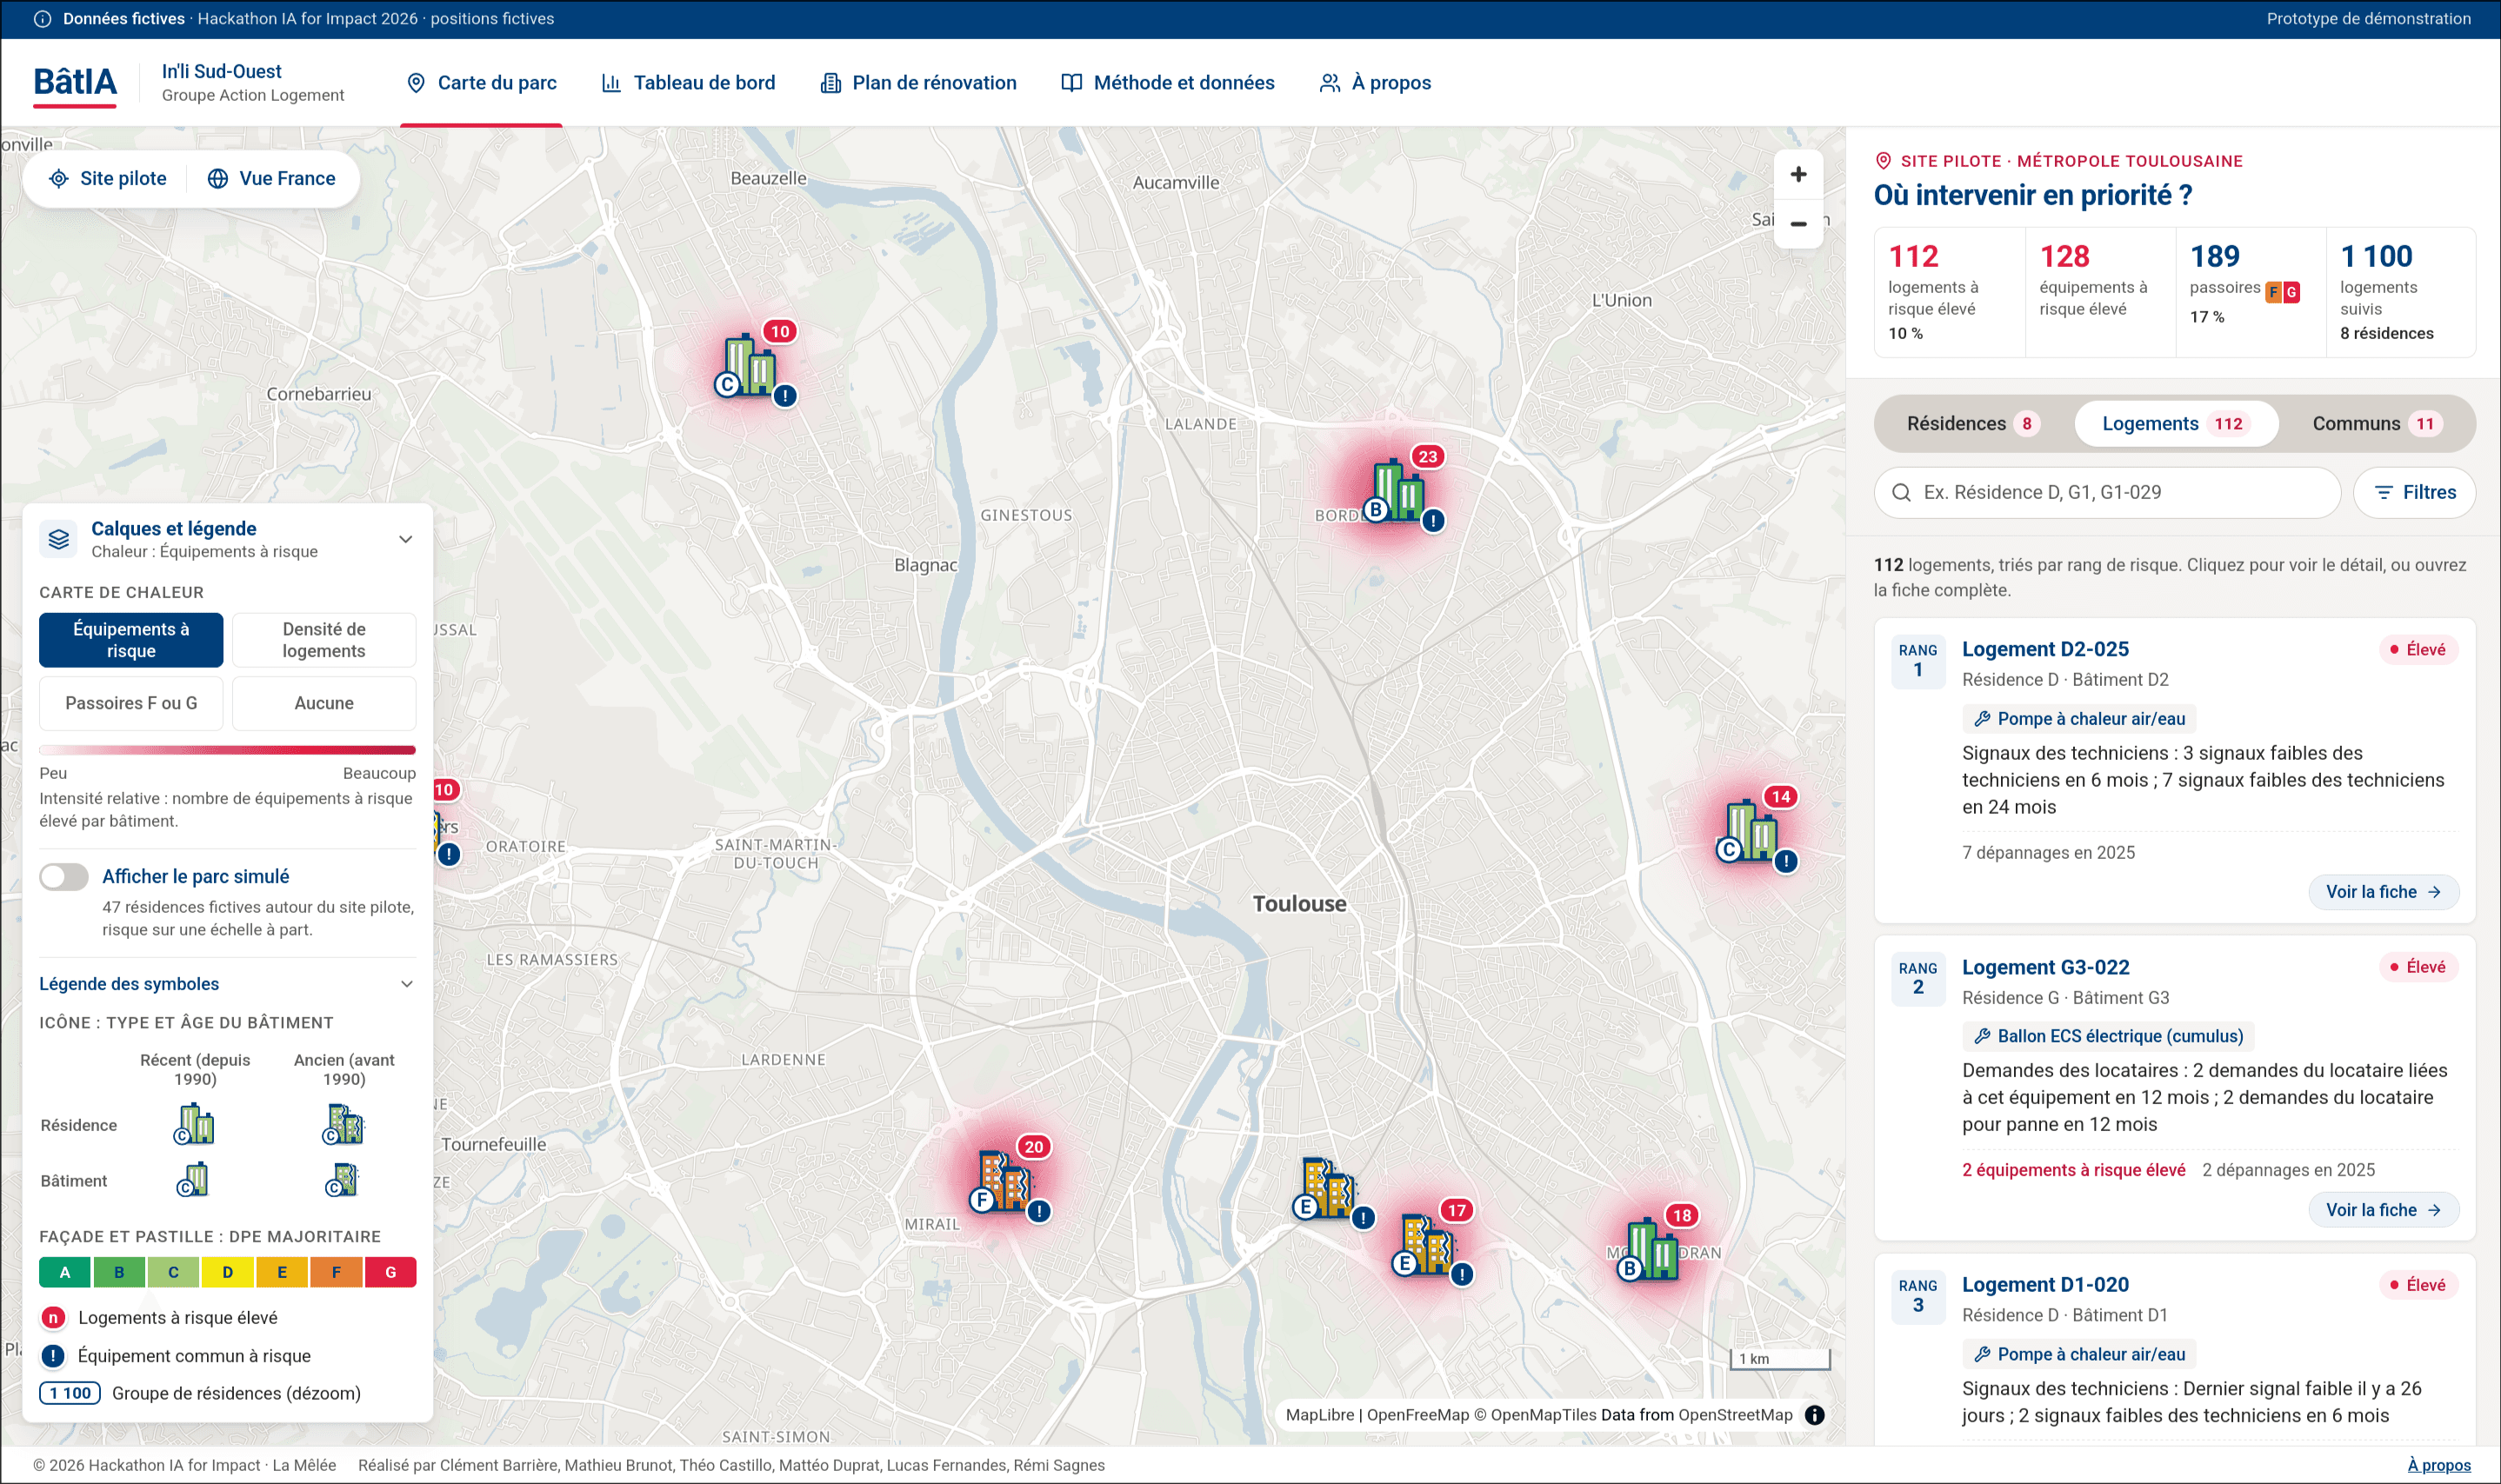
Map of the estate
Residences, buildings, dwellings and equipment, drilled down in that order and ranked by risk, with three heat-map layers: equipment at risk, density of dwellings, and the F and G energy ratings.
-
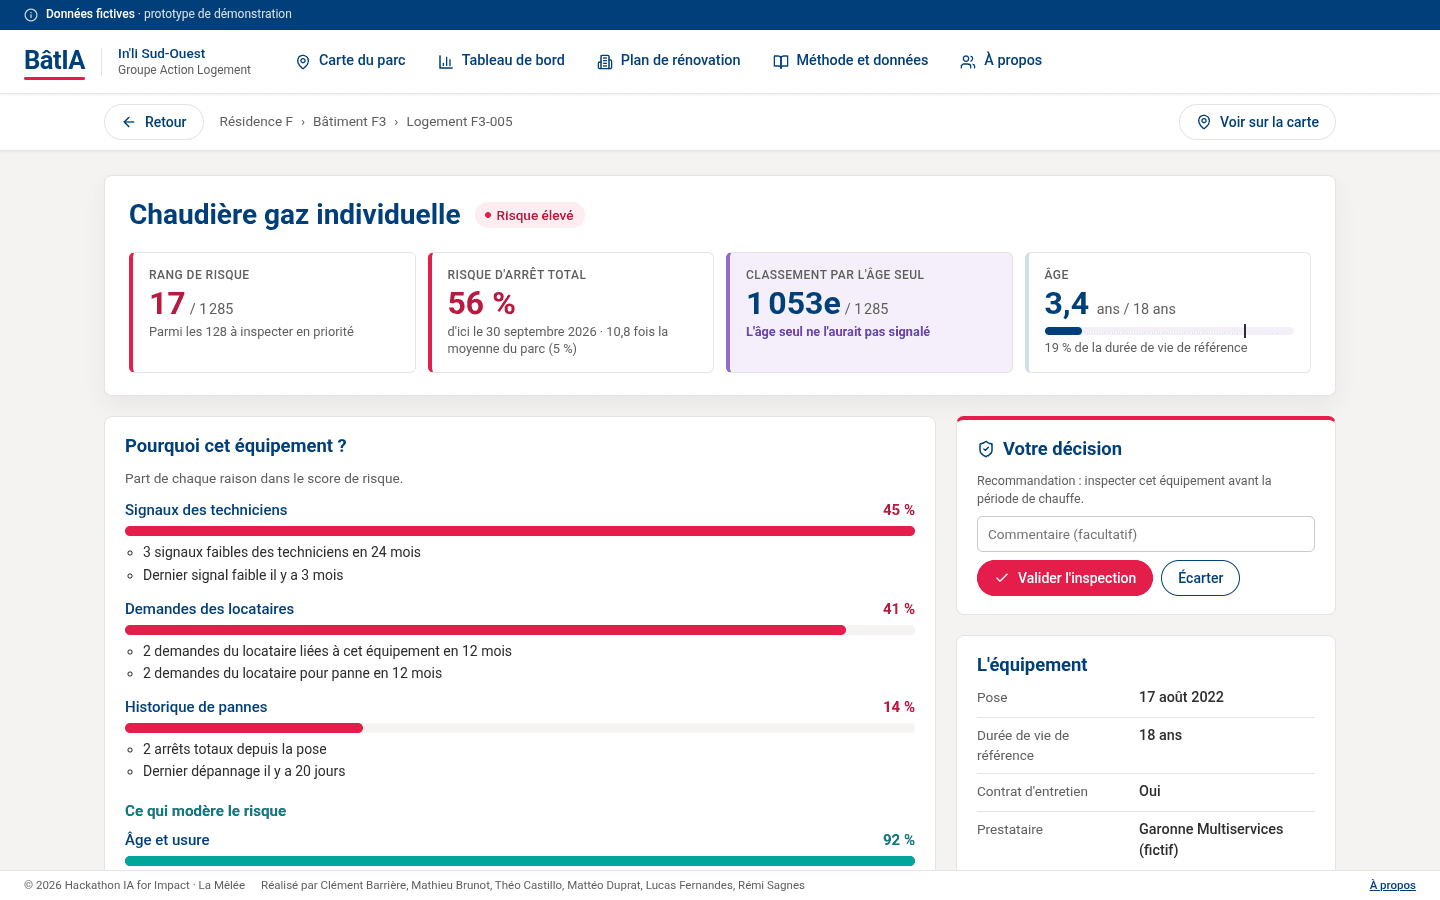
Equipment sheet
Why this one: the share of each reason in the score, the timeline of past interventions, the tenant requests of the last two years, and a decision — have it checked, or dismiss it.
-
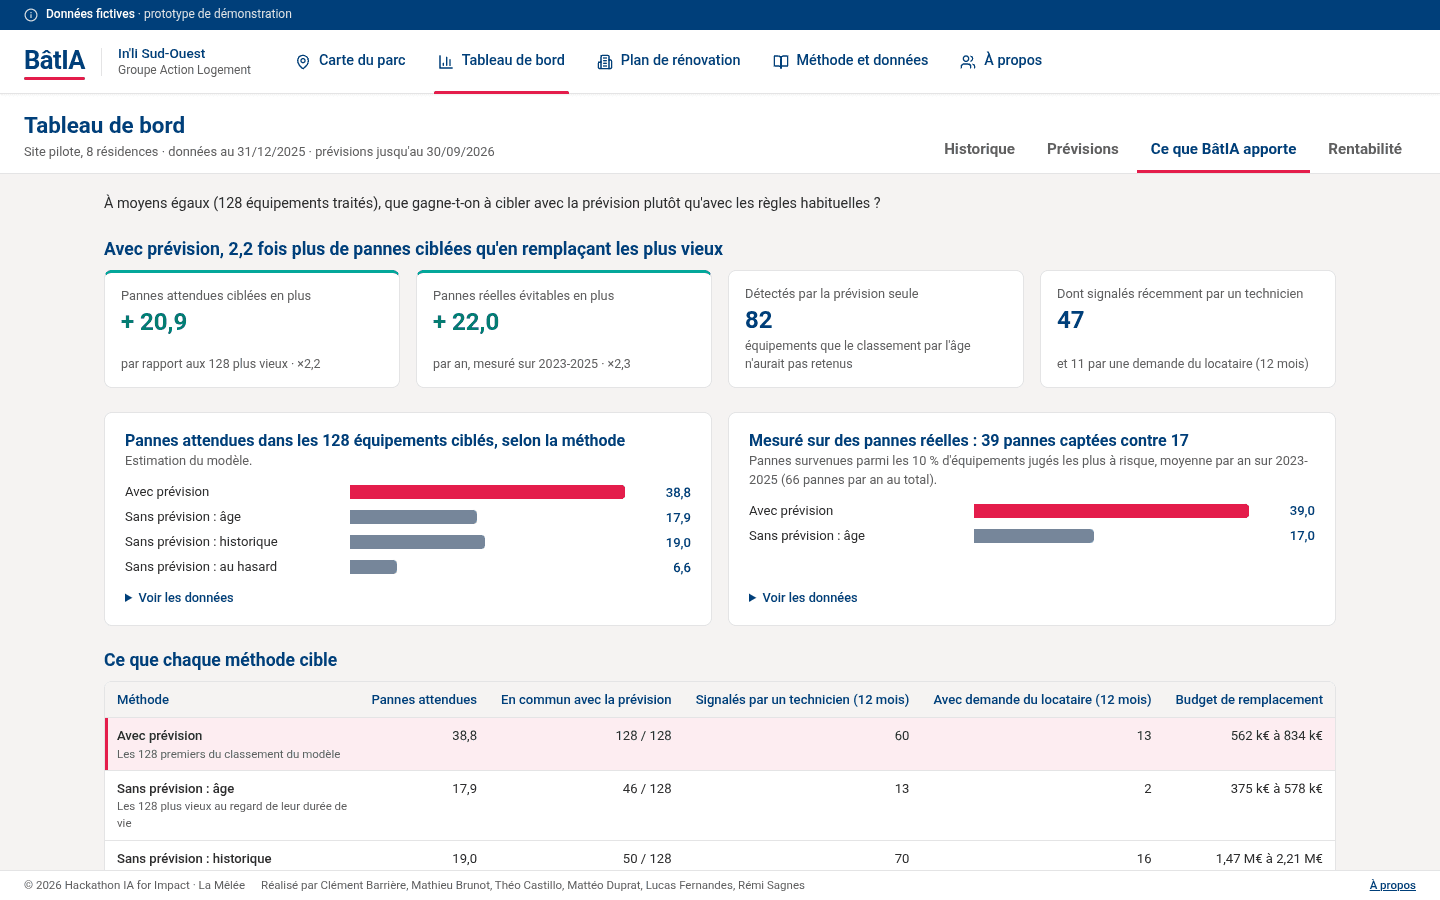
Dashboard
What the prediction adds at equal effort: the model compared with the age rule, with history and with chance, on the failures that actually happened.
-
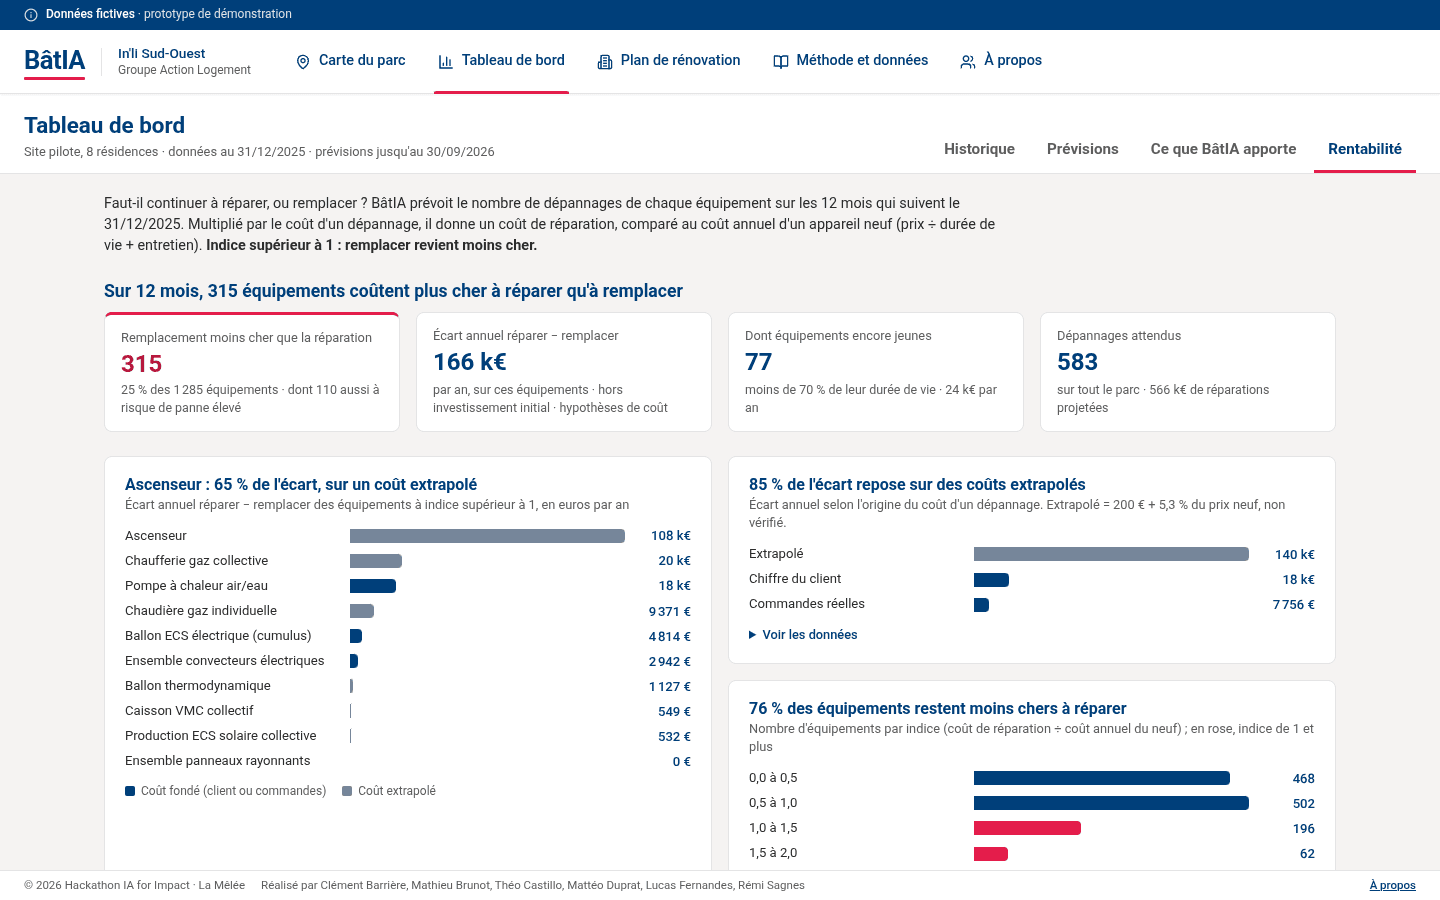
Repair or replace
A repair cost projected over twelve months against the annual cost of a new unit. Above one, replacing costs less — and the origin of every figure is shown.
-
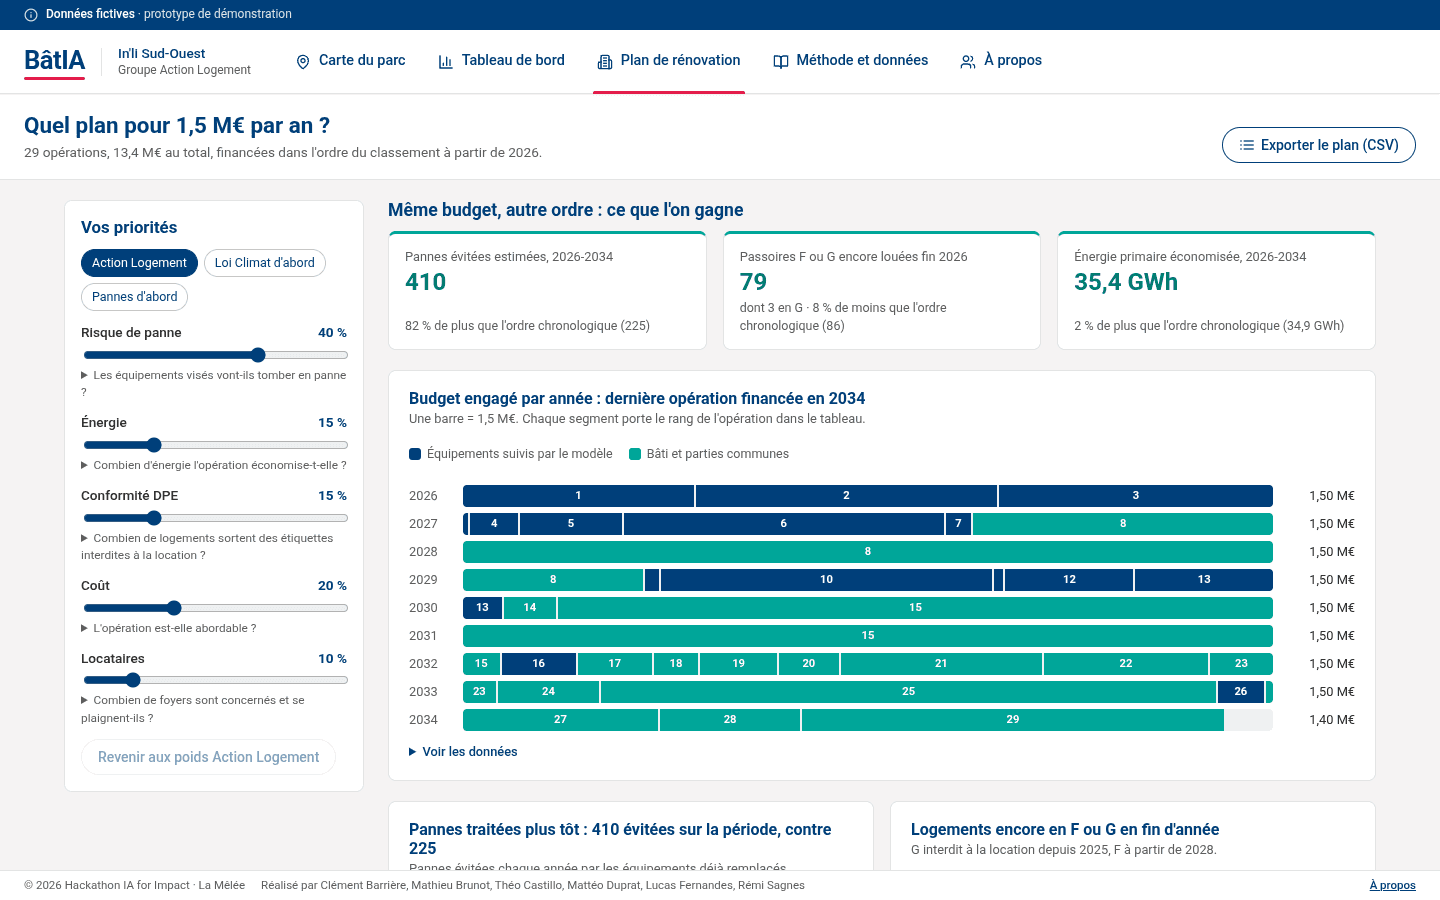
Renovation plan
29 operations scored on five weighted criteria (risk, cost, energy, energy rating, tenants) and spread under €1.5 M a year. Moving the weights re-ranks the plan live, and it exports to CSV.
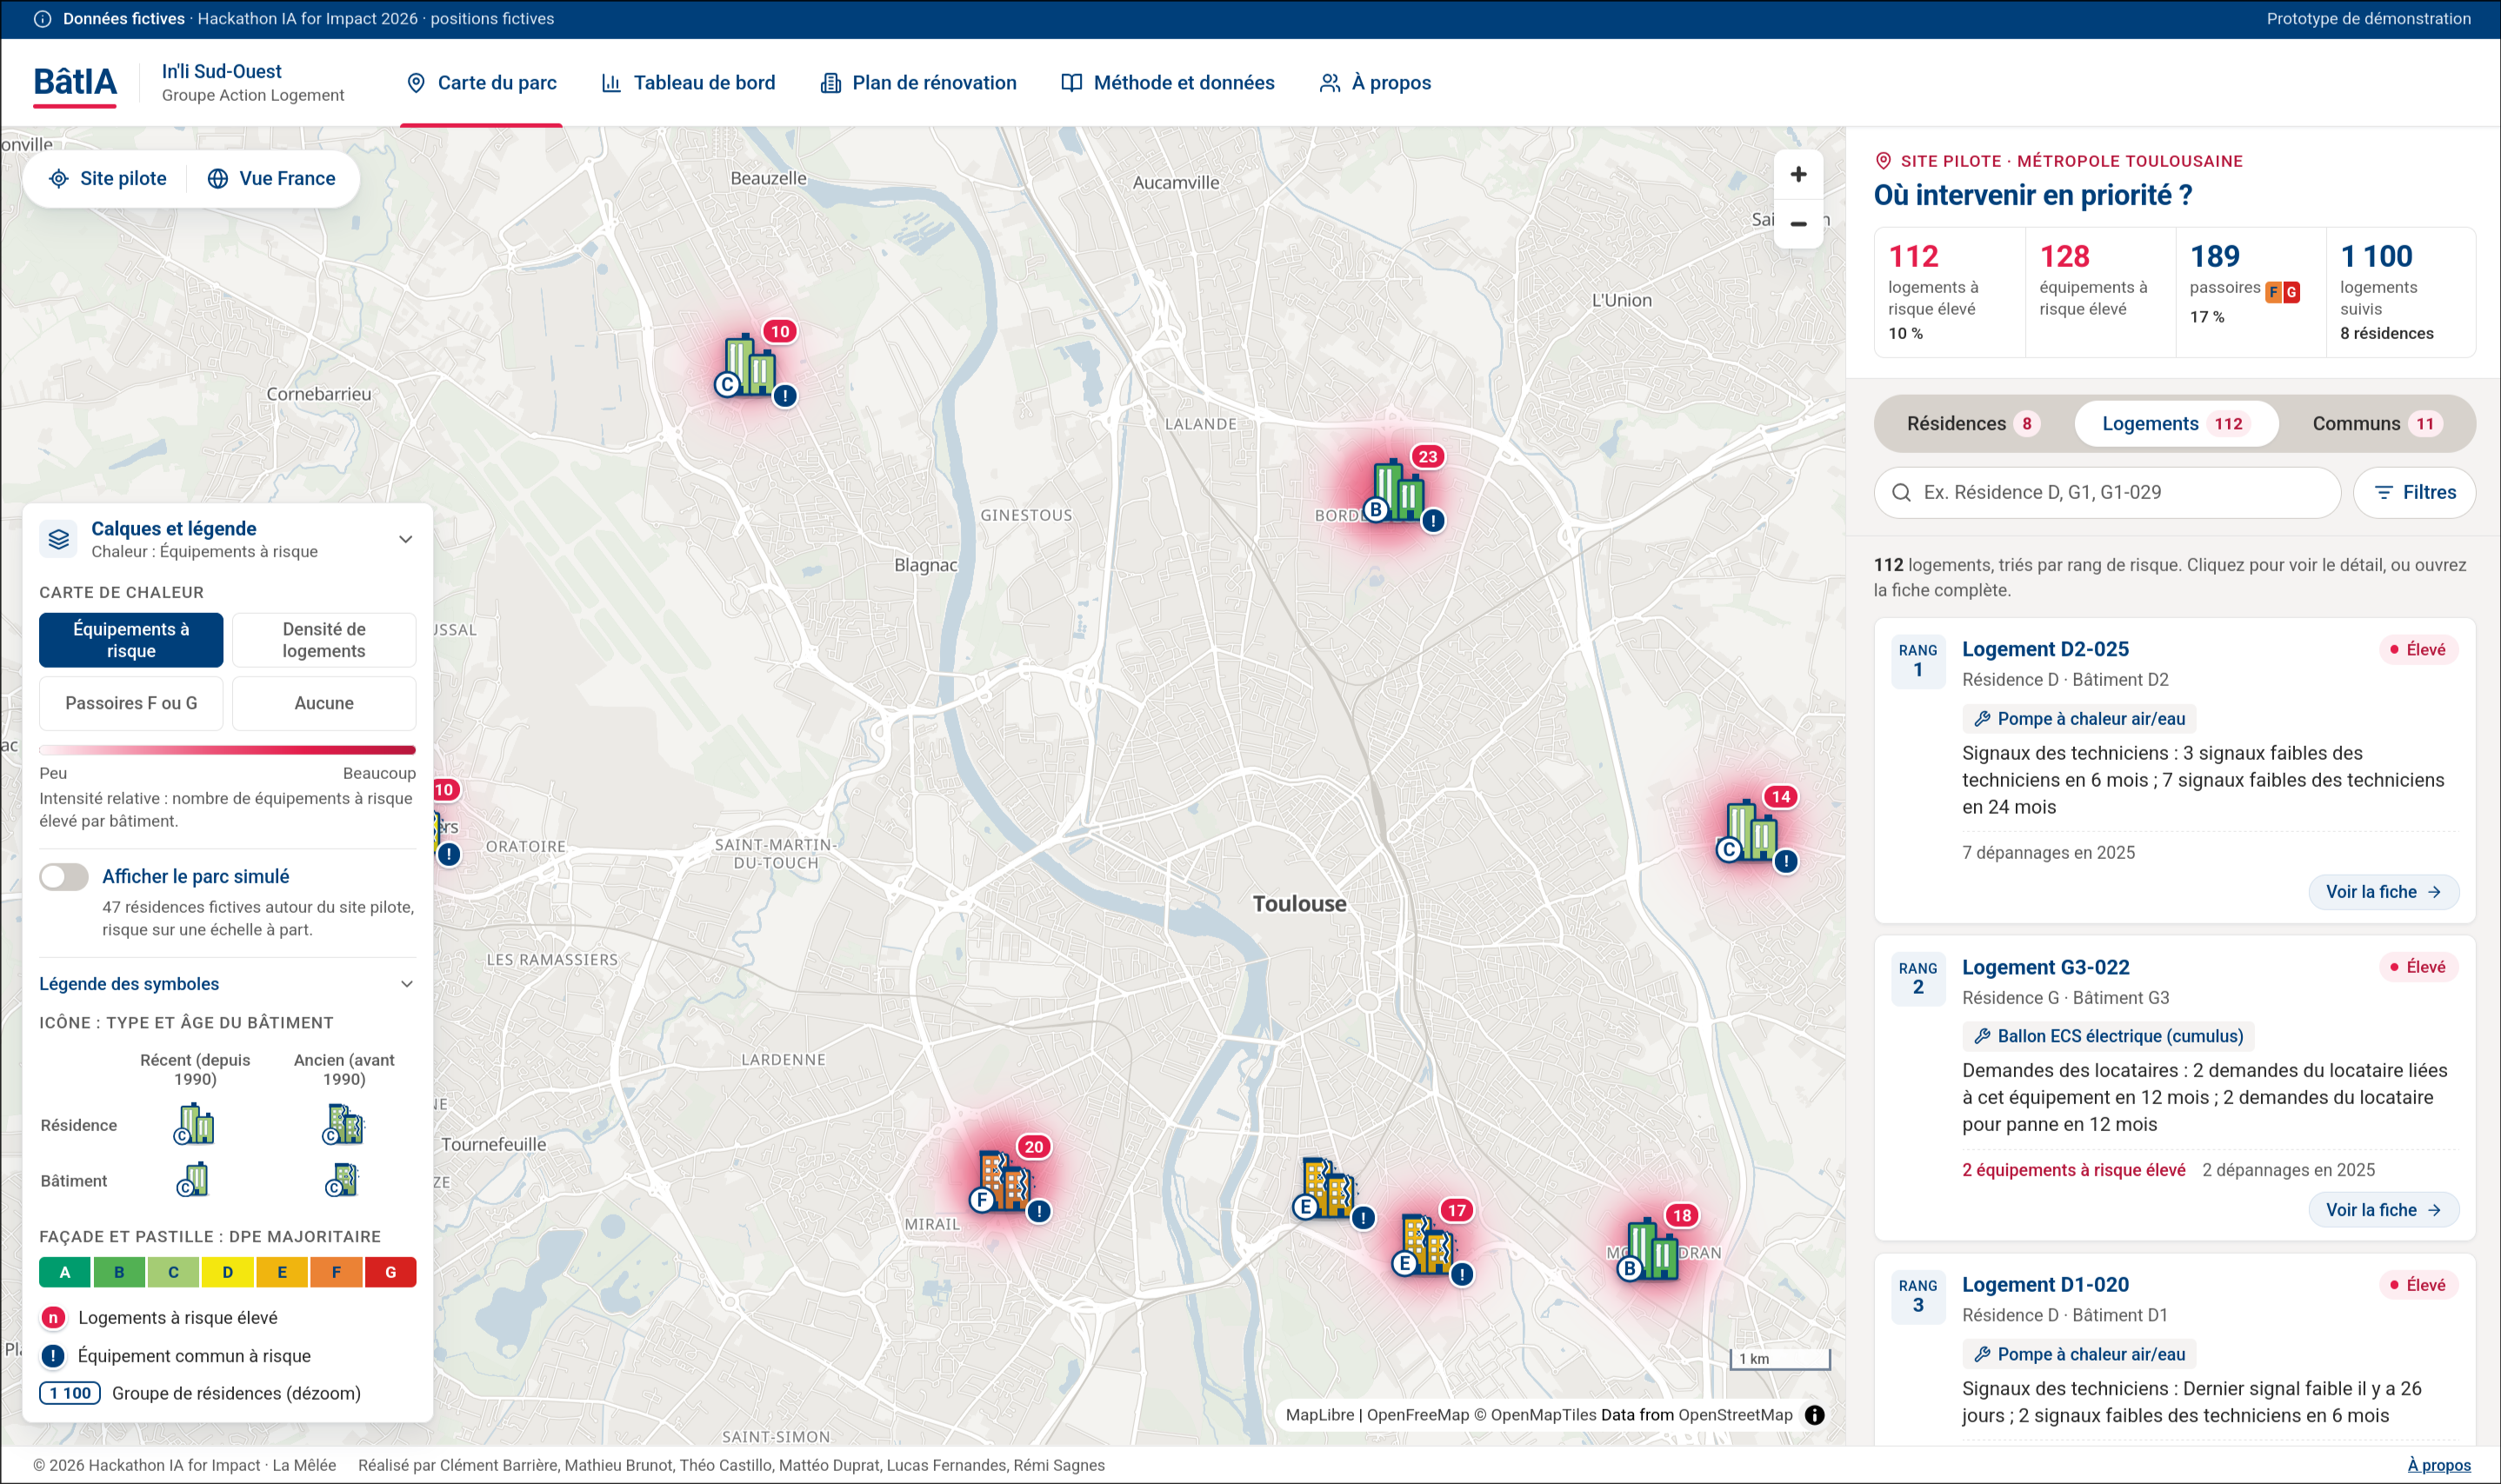
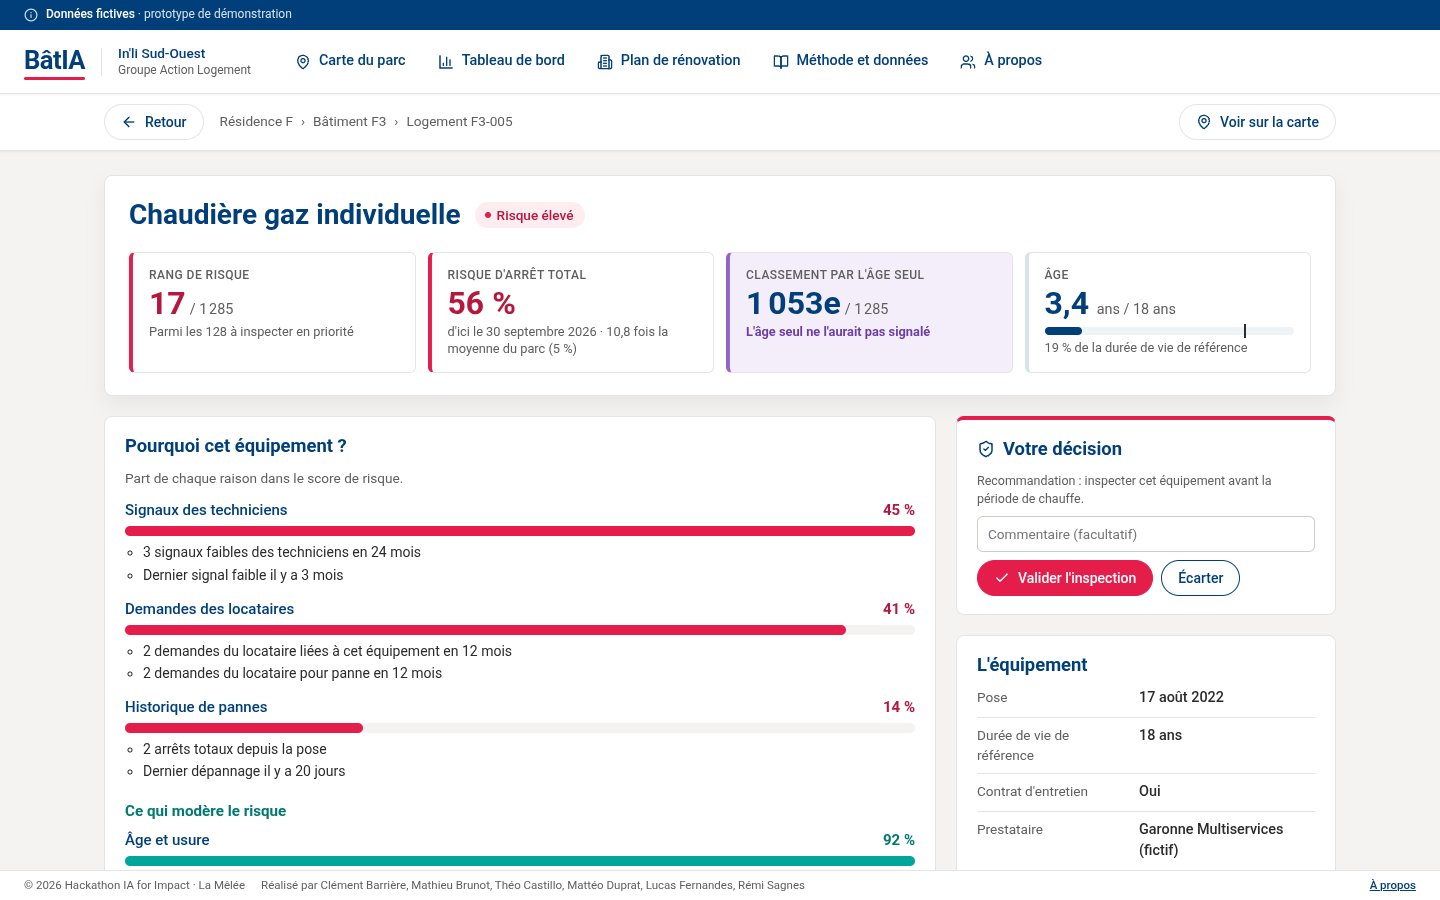
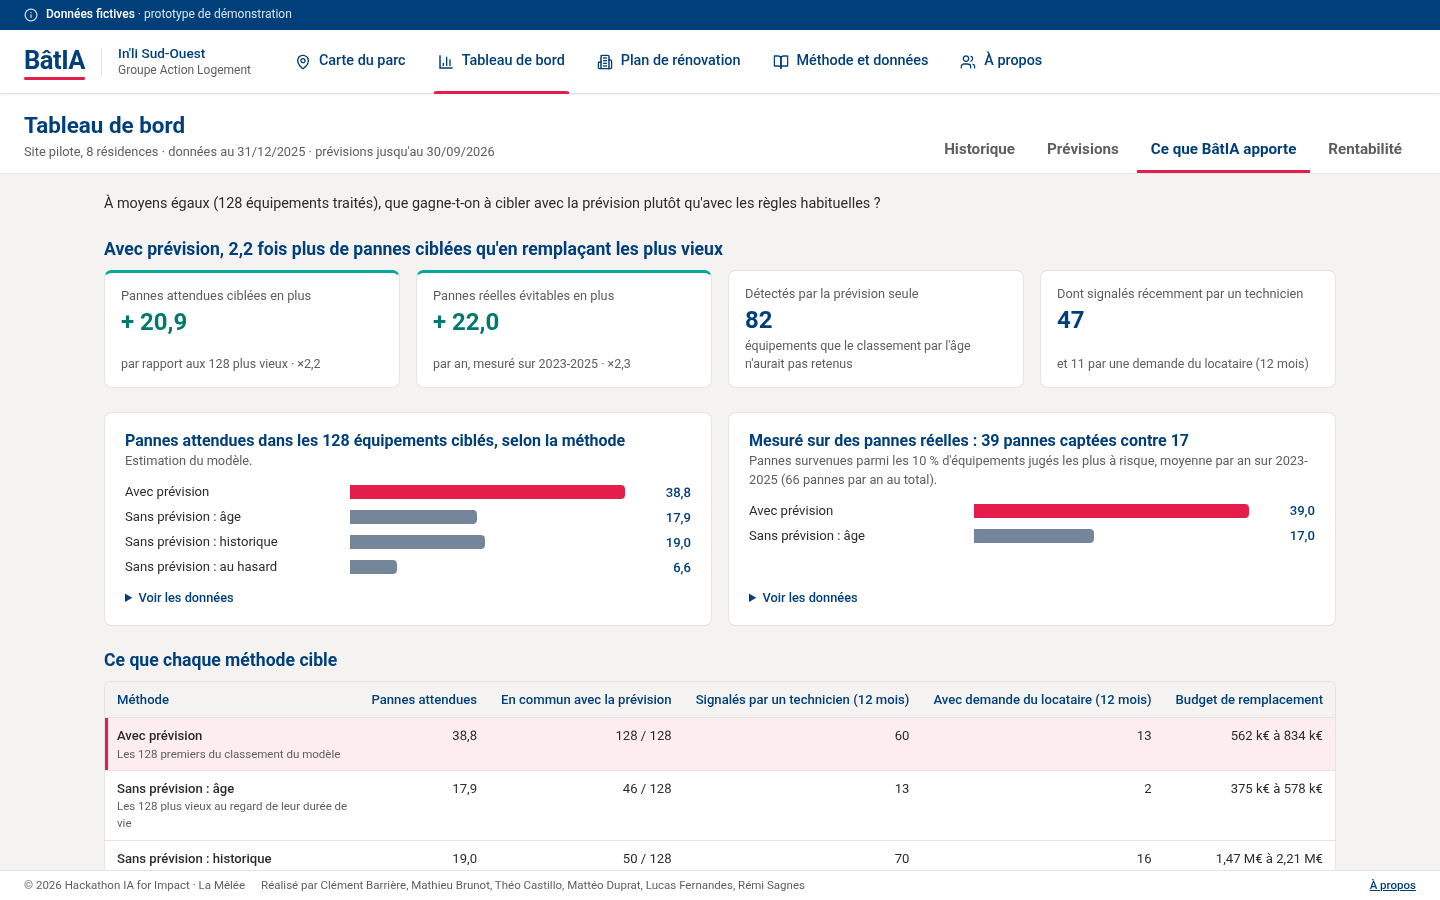
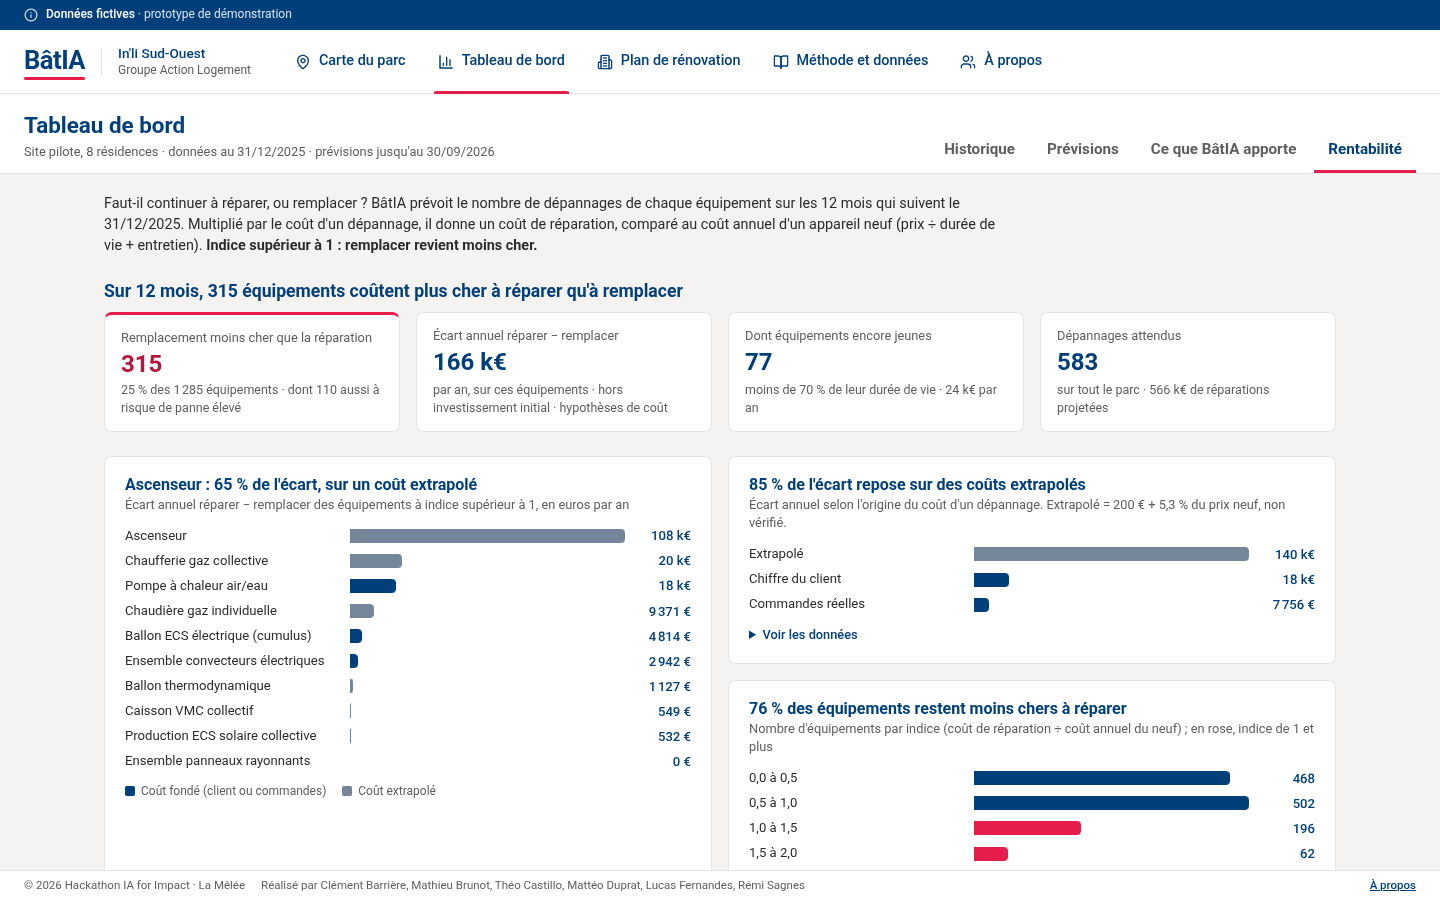
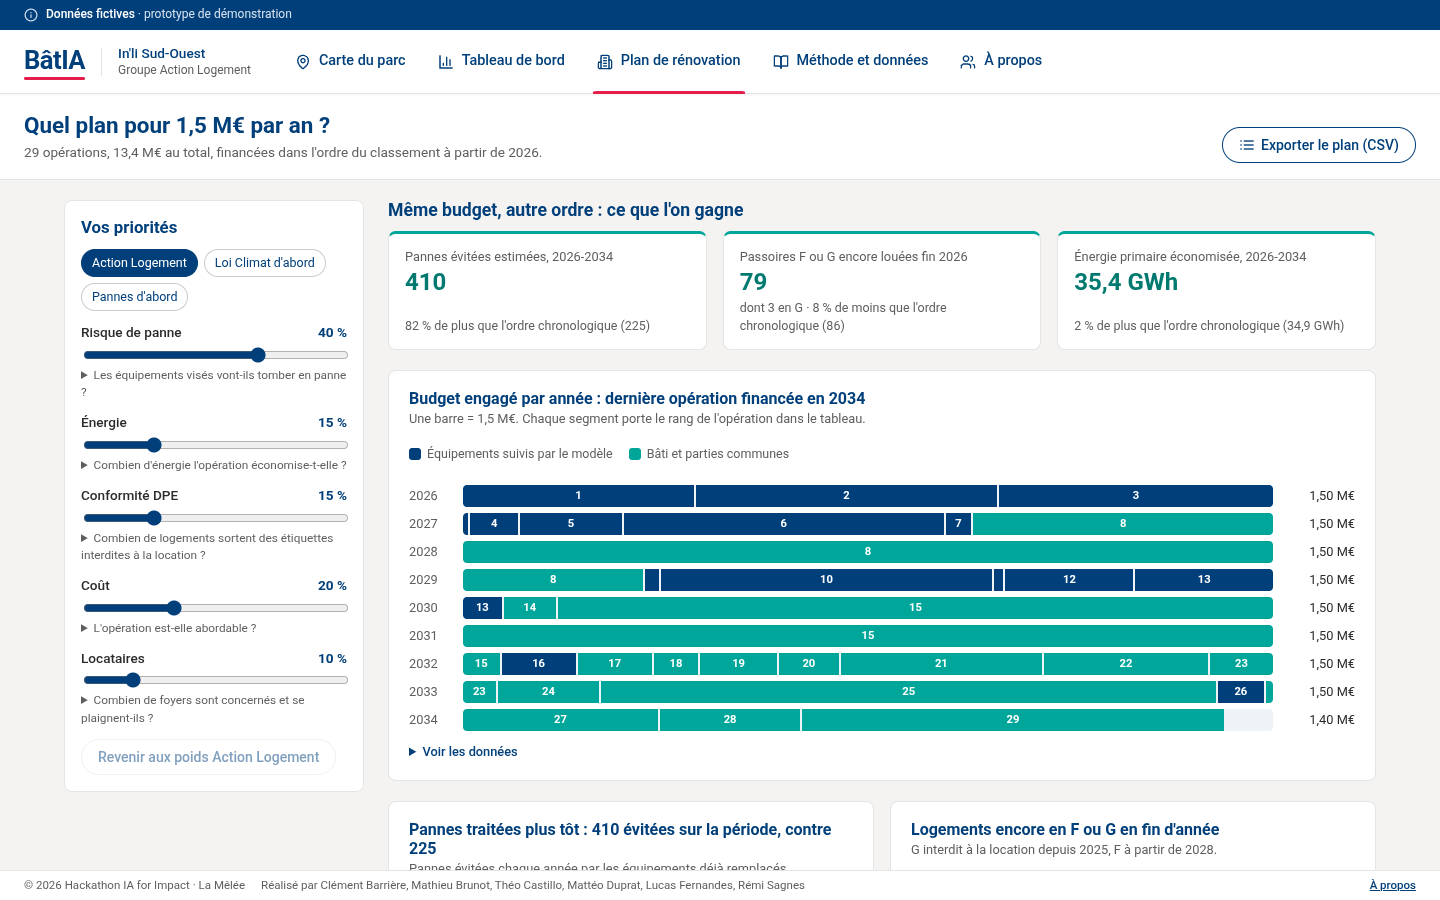
Screens of the prototype as it was demonstrated. Every figure on them comes from the challenge’s fictitious data kit.
What it changes
The prototype separates what was measured on the kit’s real failures from what the models estimate — a distinction we kept on every slide of the pitch.
-
39 vs 17
Failures caught by inspecting 128 items, 10% of the estate
Mean over 2023–2025, against the age rule, on failures that actually happened.
measured
-
0.871 vs 0.756
Ranking quality (AUC)
The model is retrained on 31 December each year, then tested on the following year.
measured
-
3.1 months
Median lead time between the alert and the failure
Enough to turn an emergency call-out into a planned order.
measured
-
under 20 ms
Response time for an estate twice the size of In’li’s
13,802 dwellings and 20 simultaneous users on one small server, no errors.
measured
-
410 vs 225
Failures avoided by the renovation plan, 2026–2034
Same budget, different order. Estimated from the model’s probabilities.
estimated
-
€166 k
Gap between repairing and replacing, per year
On 315 items, before the initial investment, with repair costs partly extrapolated.
estimated
How it was built
- Two models trained offline on the data kit: an explainable boosting machine that gives each piece of equipment a risk of failing, with the reasons behind it, and a second one that estimates how many repairs it will need over a year.
- Scores computed once and written to CSV files: neither the API nor the front end runs any inference, so a new model is plugged in by swapping a file, and the demonstration runs offline on a laptop — it could not depend on the venue’s Wi-Fi.
- Two layers at runtime, a FastAPI service and a Vue front end, with a written API contract for every route, so that the model, API and front-end workstreams could move in parallel without waiting for one another.
- A deterministic generator (standard library, fixed seed) for the fictitious estate the map needs: the kit holds only 8 residences, which left the heat map almost empty, so it places them in Toulouse districts consistent with their era and clones 47 fictitious ones — 129 buildings, 4,296 dwellings, 3,969 pieces of equipment — from the kit’s own profiles.
- Ageing modelled rather than scattered: installation dates as successive replacements with Weibull lifetimes, shortened where maintenance is poor, and a simulated risk weighted by family and by residence — a mean score of 0.06, close to the kit’s own 5.9% failure rate, so the three heat-map layers tell three different and plausible stories.
- A rule written into the code and the documentation: this generated data is for display only, never for training or evaluating the models, and every file carries a FICTIF suffix. The generator checks its own output before writing it.
- A visual language for the map: the shape of a marker is the construction era, its colour the energy rating, and the heat map has three monochrome layers — risk, density of dwellings, and the worst energy ratings.
- 101 automated tests across the models and the service, and a load test at twice the size of the landlord’s estate.
Delivered in 30 hours
- A prototype that runs end to end: map, equipment sheet, dashboard, profitability and renovation plan
- Two explainable models, retrained and checked against the failures of the following year
- An API of around twenty routes, 101 automated tests across the models and the service
- The architecture note and the API contract, and the synthetic estate with its generator
- A pitch deck and a five-minute pitch in front of the jury
Terms
- EBM (Explainable Boosting Machine)
- A model whose score is the sum of the contributions of each variable: the reasons shown on screen are exactly the ones that made the score.
- DPE
- The French energy rating of a dwelling, from A to G. F and G are the worst, and renting them is being phased out by law.
- In’li Sud-Ouest
- The Action Logement subsidiary that set the challenge: an intermediate-rent landlord with around 6,300 dwellings in the region.
Problems solved
-
A heat map with eight dots on it
The kit covers a single pilot estate, so the map looked empty at city scale and the demonstration fell flat. Rather than invent anything about the real estate, the prototype generates a fictitious one around Toulouse, cloned from the kit’s own profiles for the same era, labelled as simulated on screen and excluded from the models by rule.
-
Six people, thirty hours, one prototype
Writing the architecture and the API contract in the first hours cost time the team did not have, and saved more: each workstream built against a written contract instead of against the others’ unfinished code, and the integration at the end was a series of merges rather than a rescue operation.
-
Fictitious data still has to be realistic
Random points would have produced a heat map that lies. Equipment lifetimes are drawn from a Weibull distribution around their reference life and the risk is weighted by family and by residence, so that density, poor energy ratings and risk form three distinct shapes on the map — as they would on a real estate.
Limits and next steps
What a 30-hour prototype on fictitious data does not prove.
-
The data is fictitious
The kit is synthetic, and on the map the positions and 47 of the 55 residences are generated. The figures describe the kit, not In’li’s real estate.
Connect it to the landlord’s real data and measure the failures actually avoided.
-
Measured and estimated are not the same
The 39 failures against 17 are measured on failures that happened. The plan’s 410 and the €166 k are model estimates, and the repair costs are partly extrapolated.
Confirm the costs against real invoices before putting a euro figure in front of a board.
-
A prototype, not a service
Accounts, data import and field feedback exist, but nothing is hardened: no deployment and no real users.
A pilot with the landlord’s own teams, and retraining on their history.